Bootstrap confidence intervals: work through every resample
Enumerate a small bootstrap distribution, calculate a percentile interval and explain what its uncertainty does and does not represent.

A bootstrap uses the observed sample as an empirical distribution and repeatedly samples from it with replacement. Calculating a statistic on each resample approximates how that statistic could vary under repeated sampling from the empirical distribution. A percentile interval takes selected quantiles of those bootstrap statistics.
The method does not produce new information about a population that the original sample failed to represent. Its usefulness depends on the sampling design, statistic and interval method. A tiny exact example makes those assumptions visible before we move to larger Monte Carlo implementations.
Enumerate a complete teaching example
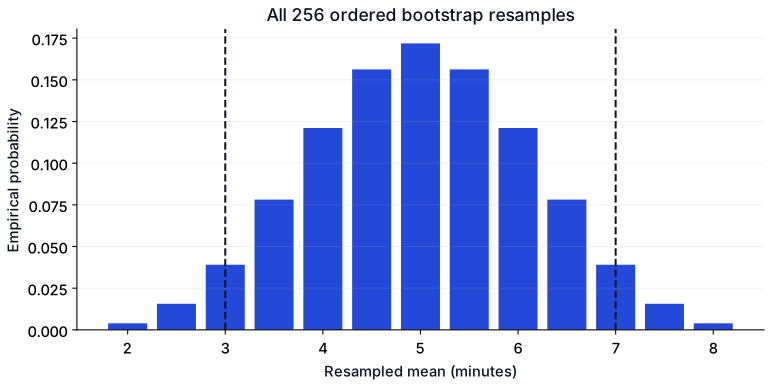
Suppose four invented waiting times are [2, 4, 6, 8] minutes. Their mean is 5 minutes. A bootstrap sample has four draws with replacement from these four positions. There are 4⁴ = 256 ordered draws, each with the same probability under the empirical distribution.
Real datasets usually have far too many possible resamples to enumerate, so software draws a random subset. Here we enumerate every possibility. That removes random-seed variation and lets us inspect the whole bootstrap distribution.
from itertools import product
import numpy as np

observations = [2.0, 4.0, 6.0, 8.0]
means = np.array([
    sum(sample) / len(sample)
    for sample in product(observations, repeat=len(observations))
])
lower, upper = np.quantile(means, [0.025, 0.975], method="linear")
print("ordered resamples:", len(means))
print(f"sample mean: {np.mean(observations):.1f}")
print(f"percentile interval: [{lower:.1f}, {upper:.1f}]")
assert means.min() == 2.0
assert means.max() == 8.0
assert np.isclose(means.mean(), np.mean(observations))

constant = [5.0, 5.0, 5.0, 5.0]
constant_means = [sum(s) / 4 for s in product(constant, repeat=4)]
print("constant-data range:", min(constant_means), max(constant_means))
Expected output:
ordered resamples: 256
sample mean: 5.0
percentile interval: [3.0, 7.0]
constant-data range: 5.0 5.0
The interval is an output of the specified empirical-bootstrap procedure. Four observations are enough to demonstrate its arithmetic, but do not establish that this procedure has good coverage for a real waiting-time population.
Interpret a confidence level correctly
A confidence procedure's coverage concerns how often its intervals contain the fixed population quantity across repeated samples under its assumptions. It does not mean 95% of individual waiting times fall within this interval. It also does not assign a 95% frequentist probability to the population mean lying in this particular fixed interval.
The NIST explanation of confidence limits for the mean distinguishes the interval from the long-run behavior of its method. Bootstrap intervals need their own coverage justification; choosing the 2.5th and 97.5th percentiles does not automatically make actual coverage exactly 95%.
Notice what resampling cannot fix
Every resampled waiting time comes from the four values we observed. The bootstrap cannot discover an unobserved long-delay population or repair a sample that excluded a whole type of customer. The constant-data example makes this clear: all bootstrap means equal 5, although four identical observations do not prove the population has zero variability.
Ordinary resampling also treats the observed units as exchangeable draws. If the records are repeated measurements from the same person, resample at the appropriate cluster level. If dependence over time matters, use a method designed for that structure. Randomly resampling individual dependent records can understate uncertainty.
Choose the statistic and interval method
The mean is convenient because it has a clear interpretation and this example is symmetric. Medians, extreme quantiles, ratios and statistics near a boundary can behave differently. Percentile, basic and bias-corrected accelerated intervals are different procedures, and increasing the number of resamples does not remove every bias or design problem.
For a larger implementation, specify the statistic, resampling unit, interval method, number of resamples, confidence level and random generator. Monitor Monte Carlo stability by increasing resamples or repeating with another seed. That checks the approximation to the bootstrap distribution; it does not validate the original sampling design.
Extend the calculation
Replace the sample with [2, 4, 6, 40]. Inspect the bootstrap means and interval. Explain why repeatedly selecting the large observation changes the distribution. Then compare the mean with the median, keeping the resampling mechanism unchanged.
Finally, write down a plausible sampling process for real waiting times. Are observations independent? Did the collection window miss busy periods? Those answers matter before choosing a more sophisticated interval. Continue with Statistics resources for evidence and estimation, and p-values explained for a different question about a specified null model.